Industry Insights
Azure Sentinel Design Product Updates
October 19, 2020 | 4 min read
BlueVoyant

This blog originally appeared on the site, Managed Sentinel - now a BlueVoyant Company.
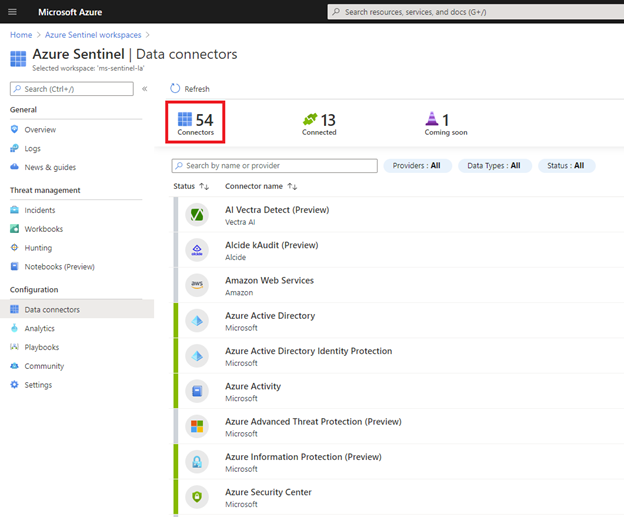
On July 21st 2020, Microsoft announced a new set of Azure Sentinel data connectors for some important security solutions providers. This is great news for our Sentinel customers, as the ability to ingest logs from a wide variety of log sources is one of top requests, along with data optimization (how can I reduce my Azure bill?) and ability to use SOAR automation to full extent (how can I automate the incidents response, so my SOC team will not need to do manual work?). Currently, there are 54 build-in data connectors in Azure Sentinel, covering a broad set of technologies:
Another important fact related to these newly released data connectors is that Microsoft also provided a few very good workbooks in support of these additional log sources.
Sentinel enthusiasts know that Microsoft Sentinel GitHub community is also a good repository for some of the previously released data connectors and log parsers. As we’ve seen in practice, these data connectors usually require additional customization, including some development, but hey…this is based on best effort from our fellow Sentinel friends.
In this article, we are sharing with you our own experience in successfully creating custom data connectors and log parsers for our clients.
When you develop a new custom data connector, you need to consider the classification criteria, as well as the following key points:
1. Syslog ingestion:
These are not really data connectors but rely on the capability of the remote devices to send syslog messages. These messages end up on Sentinel Log Analytics Syslog table, where we have created log parsers to extract the relevant data for Sentinel analysis. E.g. network switches, NACs such as Aruba ClearPass.
2. Logstash ingestion:This is a more advanced way to ingest data from remote devices, and it is based on Managed Sentinel’s customized Elastic Logstash instance deployed on customer’s premises. Taking this approach, the data is ingested, parsed, optimized and enriched at the index time, allowing full control on the volume of data ingested in Sentinel. The flexibility on using various inputs, filters and outputs makes Logstash a must-have tool for any analyst willing to master log management. In most cases, Logstash is deployed on the same syslog collector VM.
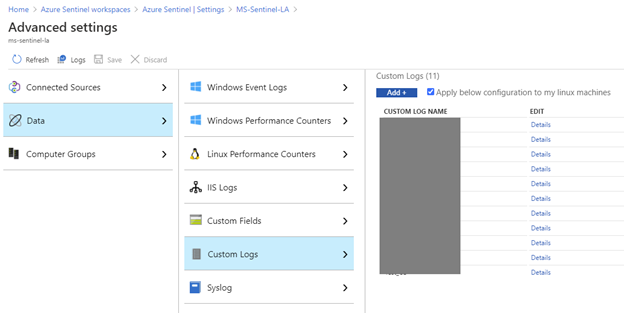
3. Microsoft Monitoring Agent (MMA):Using the Sentinel Custom Log ingestion method, we can extract log files from the systems where MMA agent is running. We used this method to extract logs from Exchange on-premises, Apache Tomcat, Radius, etc.
 4. REST APIs:
Applicable to SaaS applications, this method requires some development from our side: we access SaaS application REST APIs using Python, C# or PowerShell (depending on the API specifications), extract the relevant logs, process and upload them to in Sentinel’s Log Analytics Workspace. The REST APIs can be accessed through scripts running on on-premises or cloud servers or part of Sentinel playbooks using Logic Apps. Microsoft recommends the use of Azure functions (serverless computing) to onboard this type of data. This data ends up in _CL (custom tables) in Log Analytics and our team has created several alert rules to match these tables. E.g. Duo MFA, CloudFlare WAF, G-Suite, Oracle Cloud Infrastructure, AWS CloudWatch etc.
5. Azure PaaS resources:We have decided to add this category here, as Microsoft has a rich portfolio of PaaS applications running in Azure. Many of our customers are requesting the ability to ingest logs from these applications and have relevant Sentinel alert rules. Usually, the data is extracted and passed to Sentinel Log Analytics by configuring diagnostics for the specific resources and sending the logs to the Sentinel Log Analytics Workspace (and in most cases the data ends up in the AzureDiagnostics Sentinel table).
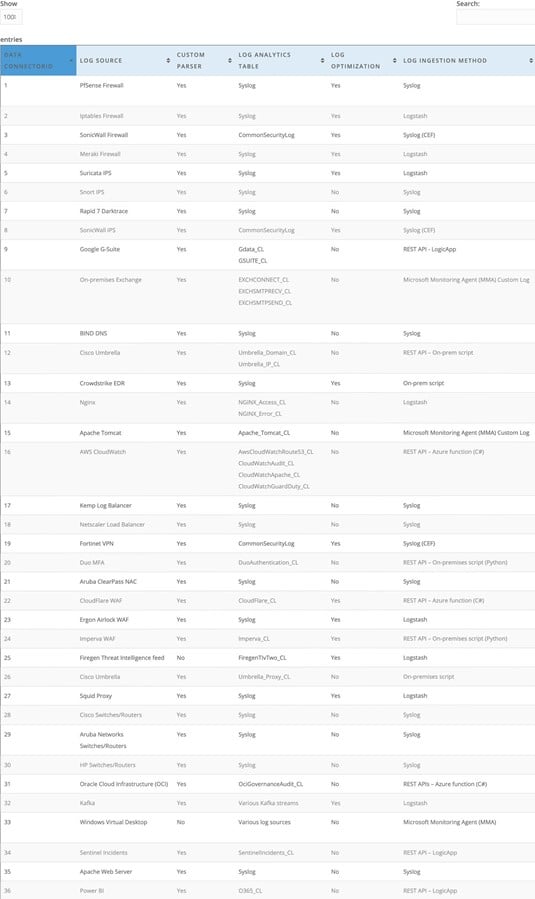
The following table represents the current list of data connectors and/or parsers developed or maintained by Managed Sentinel team based on the classification described above:
For all these log source types we have created log parsers as well as several Sentinel alert rules to allow our customers to analyze and correlate this data with other data ingested in Sentinel via Microsoft native data connectors.
Our team has completed a large number of Azure Sentinel deployments, and we continue to create new data connectors almost every week so if you have a particular log source that may seem challenging to onboard into Sentinel, arrange a consultation with us to discuss it. From our perspective, as long as the data exists somewhere, in a structured format, it can be collected through one of the methods described above.
While most SIEM platforms can ingest custom log sources, what makes Azure Sentinel special is the relative ease of onboarding some logs that are a serious challenge for other products. What can take weeks or months of efforts for some, it takes hours or days for Sentinel.
Related Reading
Industry Insights
Ransomware in First Half of 2025: An Ecosystem in Flux
Managed Detection and Response
Why Microsoft Sentinel data lake Signals the Future of Security Operations